Reston Spring

Reston Spring
Reston Spring
Showing posts with label Population. Show all posts

Tuesday, June 27, 2017

Migration to D.C. remains stable, but plummets for rest of region, Mike Maciag, DC Policy Center, June 20, 2017

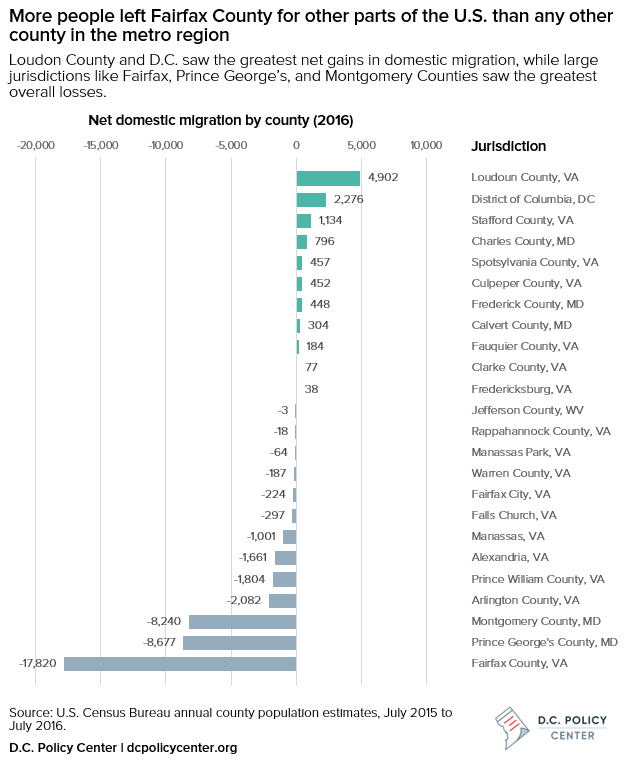
In a report analyzing the region's migration pattern by county last year, Mike Maciag of the DC Policy Center highlights the huge losses in population in the region's suburbs versus the small gains in Washington, DC.  Unfortunately, Fairfax County led the region in migration losses with a net negative migration of 17,800. 

Here is some of what Maciag says about the overall migration shifts:
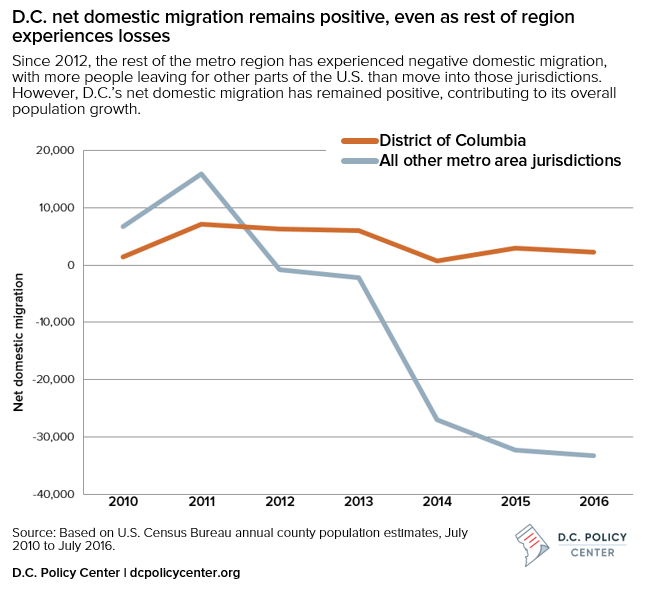
For each of the past three years, more people have left the D.C. metro area for other parts of the country than moved in. In 2016, the reported net domestic migration loss topped 31,000 — the steepest decline in years. That represents a stark reversal from the immediate post-recession period when the region enjoyed especially strong population gains. Much of the shift is explained by the economy: The Greater Washington region weathered the recession better than other parts of the country, but jobs have since returned in places that previously sustained severe job losses.
DC net domestic migration remains positive, unlike the rest of the metro region

More worrisome for Fairfax County is the fact that its migration loss accounted for more than half of the total negative net migration and, at -17,800 people, was more than double the second worst loser, Prince Georges County. 


Monday, April 20, 2015

US Census estimates say people are leaving Fairfax County.

An article by Antonio Olivo in the Washington Post, April 20, 2015, says Fairfax County experienced the worst net migration in the Washington metro area in 2014 according to US Census data.  


Here's how the article begins:

 After decades of expansion, new census numbers show that population growth in the Washington region has slowed dramatically, with Fairfax County, Arlington County and Alexandria seeing more people move out of those communities than move in over the past year.
The numbers offer stark evidence that a region defined for much of the last half-century for its affluence and growth is entering a different phase, when federal spending cuts are slowing job gains and declining suburbs are presenting new challenges for local leaders — even as pockets of extreme wealth continue to boom.
The portrait is emerging at a time when the nation is recovering from a deep recession that the Washington region largely avoided.
“Especially for young people, this may be the tip of the iceberg,” said William H. Frey, a senior fellow at the Brookings Institution. “If the broader picture is that there are more jobs in a place like Atlanta or Charlotte, then maybe some of that is pulling people away from D.C.”
The new census estimates show a dramatic trend in “out­migration” last year, with the number of people moving away on the rise — and the number moving in going down. . .
Now, Fairfax (County) is also known as the epicenter of “sequestration” — the federal budget cuts of 2013 that eliminated, according to a George Mason University analysis, 10,800 federal jobs (a 3 percent decline) and many hundreds more among federal contractors. Last year, federal spending in the region was $11 billion lower than 2010 — a 14 percent decline — according to the analysis.
All of which helps explains how Virginia’s largest county has edged closer and closer to an outright population decline. . . .

    Click here for the rest of this article.  

Long term net outmigration would have a number of effects on Fairfax County and the other counties where it is occurring, virtually all of them negative, especially if the total population starts sinking.  (We're gaining population only because of births at this time.)  Demand for housing (and, therefore, house prices) will decline, slower--or no--growth in the commercial office market that the County Board is relying on to boost employment and tax revenues in Tysons and Reston, real estate tax rates may need to increase to offset the losses or absence of growth.  In general, it may mean less economic activity in the County (vice the "booming" economy we've experienced).  On the other side of the coin, it could mean reduced growth (or actual declines) in County expenditures on a variety of programs, starting with schools (fewer children) and other public infrastructure.  

It will be important to see if this apparent trend continues or if its just an aberration.   In fact, it could even represent US Census error.  For example, the US Census estimated Reston population was approaching 65,000 people late in the last decade.  The 2010 census showed it to be less than 59,000.  Possibly the US Census is over-correcting for its earlier estimating errors.

Maybe most importantly, the article features a photo of Diane Blust, long-time Reston resident and former President of Sustainable Reston.  She is hard at work living the lifestyle she espouses near Harpers Ferry, WVA.

Diane Blust spreads fresh soil around the perimeter of her house on April 2 in Harpers Ferry, W.Va. Blust lived in Reston, Va., for 37 years before moving to Harpers Ferry to start her permaculture and sustainable living homestead. (Ricky Carioti/The Washington Post)

Friday, April 3, 2015

Apparently population growth in the suburbs and beyond is not over despite tremendous publicity to the contrary.

In fact, the University of Virginia's latest population projection suggests that while a couple of close-in suburbs--Arlington and Alexandria--will lose  population while exurb counties like Stafford and Spotsylvania will more than double their populations in the next quarter century.  An article in the Washingtonian takes a look at  the UVA study this way:
To New Exurbanites, the traditional suburbs—like the central city before them—feel full. Arlington County is now home to 229,302 people, Fairfax County to 1,118,884. It’s “saturated,” says Sue Smith, a real-estate agent in Northern Virginia for 27 years. So they trek to once-distant areas: Stafford and Spotsylvania counties and Winchester in Virginia and Frederick County in Maryland. Over the coming years, an increasing number of people settling these exurbs will be millennials, like Lindsay Arnold, and the generation that follows.
That’s not what you’d expect if you’ve been reading headlines. The prevailing wisdom about millennials is that they’re wedded to urban-style living—even in the suburbs—with craft breweries and yoga studios on every other corner and a Trader Joe’s within walking distance. But in Washington, many of the youngest homebuyers are hewing to the same patterns their parents did, according to Lisa Sturtevant, executive director of Washington’s Center for Housing Policy, the research arm of the nonprofit National Housing Conference. “The suburbs are ripe for a rebirth,” Sturtevant says. “Despite everything you hear about cities, people want a single-family home.”

Virginia counties, such as Frederick, Spotsylvania, and Stafford, are expected to have the most growth over the next 35 years. Data from US Census Bureau, UVA Cooper Center, and Maryland Department of Planning.

This is pretty much what Reston 2020 has been saying all along.  Yes, young adults--singles or couples--are looking for smaller, affordable housing close to their new jobs, near retail and vibrant nightlife, and are quite comfortable living in high-rise apartments and condominiums not unlike their college experience.  Then they start earning more money and having children, and they need more space for their growing family and even some outside space for the kids to play (and, no, a pocket park a block away doesn't fit that bill, especially for younger children), so they buy single family homes or townhomes in the 'burbs and by in large drive to work.  At the other end of the age distribution are empty nesters who are looking to downsize, reduce housing expenses, and have key retail shopping within easy walking distance and no need to commute whether by auto, transit, walking, or pedaling.  Like their young counterparts, they are likely to be more inclined to move into more affordable, higher density neighborhoods with walkable retail  in our metropolitan area--and these types are housing are spreading into the suburbs (although the costs often remain high).  In short, there is not so much a shift in the nature of housing demand overall, just a shift in where the various types of housing are needed.
15 Economic Facts about Millennials, CEA, The White House, October 2014

While the preceding life cycle of housing demand is not news in a major urban area with better-than-average incomes overall, developers would have local policymakers and the public believe we will all soon be living in high-density, high-rise, and often high-cost apartments and condos and use nothing but transit or our feet to go everywhere.  As the article suggests, the fixation on Millennials is overwhelming because they comprise about one-third of our population.  (Their relative size is a function of the fact that the "Millennial" generation covers the longest timeframe (24 years) and comprises the offspring of an ever-growing national population--including immigration--for any designated age group cohort.)

Local officials, especially in maturing counties such as Fairfax, are anxious to believe developers that the core demand for housing lies in high-density, high-rise development because it gives elected officials some legitimacy in approving high-density, high-rise development, especially near rail transit areas.  It's appealing to them because it give them an opportunity to believe they can build their localities out of stabilizing home values and a lack of space for new low-density homes that may enable them to garner additional property tax revenues without unnecessarily raising real estate property tax rates.

There are several key implications of the preceding.
Of the (Washington MSA) GRP growth, almost ¾ will be in locations where autos provide the accessibility.  . . For all economic activity in the region, the share of GRP enabled by auto travel goes from 74.3% in 2007 to 73.1% in 2040, and economic activity supported by
transit changes only very slightly from 22.3% to 22.2%.  The support of economic activity by mode changes very little over the 3-decade forecast period – surprising in light of the investments and focus of public policy to shift travel away from the auto and roads to transit.
. . .
  • Other public infrastructure needs and costs--schools, water & sewer, recreational facilities, etc.-- will also grow at least in proportion to the growth in population, the face of inflation, reduced real property value growth rates, and a desire to improve household quality of life.  It is highly unlikely that the taxes generated by housing growth alone will be sufficient to sustain existing "low" real estate property tax rates or other lesser local tax revenue sources.  This is especially worrisome in Virginia where local authority to create new taxes is substantially circumscribed by the state (although local politicians have been creative in using the authorities they have). 
  • Maturing counties like Fairfax have no significant place to add development except to go vertical, and that construction is generally more expensive than stick-built homes.  As suggested above, these high-rise, high-density homes are largely the residences of young professional Millennials and well-to-do seniors who can afford the higher rents and prices  and fees these structures require.  Yet, there is only so much of this above-average demand, and less wealthy younger and older adults are ill-served by this trend in the absence of policies mitigating this natural economic selection of residents.  This is especially important in Reston, a community that aspires to meet the needs of all people in all walks of life. 
Development and housing policies in Fairfax County and across the region need to consider the full range of issues in accommodating our growing populations and their diverse housing needs as well as their budget and infrastructure challenges.

Saturday, February 11, 2012

RCA's Stance on the Silver Line, Toll Road, Colin Mills, President, RCA, Reston Patch, February 8, 2012

This week, I received a couple of notes from friends of mine, who read about RCA's recent report concerning the inaccuracy of toll-road revenue forecasts.  Previously, they had seen RCA's resolution calling for an audit of the costs of the Metro Silver Line.  Both of these friends are eager to see the Silver Line completed all the way out to Dulles Airport and beyond, and they were concerned about RCA's actions.
One of my friends is a devoted Democrat, and he stated that local Republicans are looking for a way to remove the Project Labor Agreement (mandating the use of union labor) on Phase 2 of the Silver Line. He argued that every new assessment or civic criticism gives Republicans fodder to delay or obstruct the progress of the Silver Line.  He said that he believes "the tolls will work themselves out," but that concerns expressed by groups like RCA might lead to problems with the completion of Phase 2.
My other friend, approaching the issue for a non-partisan angle, noted that if there is a delay in the completion of Phase 2, that would mean a longer period when the Wiehle Avenue station is the terminus of the Silver Line, which would have a negative impact on Reston's welfare.  She knows that RCA has campaigned to ensure that the Wiehle station is the Silver Line terminus for as short a period as possible.  So she asked: Might RCA voicing its concerns lead to unintended negative consequences for our citizens?
Silver Line construction in Tysons Corner
 I replied to my friends' concerns, but I realized that other Restonians might share their concerns.  So this week, I want to use the blog post to explain RCA's position on the Silver Line in greater detail.  I've written about RCA's position on the Silver Line in the past, and I hope this post will clear up any lingering confusion. . .
The bottom line:
. . . RCA is not opposed to the Silver Line.  We continue to support the completion of the Silver Line all the way out to the airport and beyond.   If you read RCA's report, authored by our super analyst Terry Maynard, you'll notice that our support for the Silver Line is stated right up front. . . .
For the rest of this excellent Reston Patch blog post, click here.  

Fairfax County leader joins group in questioning Dulles Toll Road numbers, Washington Examiner, February 10, 2012

Liz Essley
A Fairfax County leader has joined a citizens group in questioning whether the Metropolitan Washington Airports Authority relied on faulty data when it predicted how high tolls would rise on the Dulles Toll Road and whether the $8 round trip cost projected earlier may be too low.
Officials are questioning the estimates just as new projections done by the same company are about to be released. Local leaders worry that tolls on the road may soar because the toll road revenue will help finance the $2.8 billion second phase of the Dulles Metro rail project. The earlier report that officials considered flawed may have underestimated how much tolls would have to increase if Fairfax and Loudoun County agree to help finance the Metro project.
“We’re aware that the numbers to produce the 2009 projections were not as accurate as they should have been, and we’re sure going to making sure that’s not the case [in the 2012 projections],” Fairfax County Board of Supervisors Chairman Sharon Bulova said. 
 Wilbur Smith and Associates studied the toll road for the airports authority in 2009 and predicted that tolls would rise to $8 by 2018. But those 2009 predictions relied on faulty data, according to a Reston Citizens Association study released earlier this year — and a Fairfax County auditor has now agreed with the citizen study (emphasis added). . . .
For the rest of this Washington Examiner article, please click here. 

Friday, February 10, 2012

Letter: Implications of Reduced Growth Prospects for Reston TOD Planning, Terry Maynard, February 9, 2012

Memo to Reston Task Force re GMU Forecasts

Wednesday, November 30, 2011

A Review of the GMU Report on the Region’s Workforce, John Hanley, November 30, 2011


Note:  This review refers to the GMU Center for Regional Analysis (CRA) report, Housing the Region's Workforce:  Policy Challenges for Local Jurisdictions, October 25, 2011.
 
A Review of the GMU Report on the Region’s Workforce
Published October 2011

The above Report addresses what may occur in the Greater Washington area between 2010 and 2030. This review assumes the reader’s principal interest lies in identifying how the Report’s conclusions are likely to affect Reston and its contiguous neighborhoods. I also tried to access press and other reaction to its conclusions, but so far found little.

I did however find a recent interview in the Washington Post with one of the Report’s authors, Lisa Sturdevant, who mentioned the fact that the basic figures were subject to recent economic factors. Sturdevant also admitted that the Report’s estimate of 730,000 net new jobs was subject to “significant uncertainty”. That was quite an understatement. Pressed, she qualified her remark to admit that “the latest predictions call for 500,000 fewer additional jobs in the region by 2030 than were forecast before the financial crisis.” Knowing that your headline-grabbing figure of 1,050,000 additional new regional jobs over the next twenty years is subject to a 50% error factor is something that should have been included in the executive summary.

Nevertheless, there is a lot of time between now and 2030 and things could well evolve more positively in the interim. In any case, the potential reduction does not take away from the importance of the Report. But it is a something that a reader should bear in mind. 

Assuming that the Report’s workforce growth figure above will come about over the next 20 years and that 731,000 extra housing units will be required in the region by then, even allowing for the error factor, it is clear that the region will have a significant problem in ensuring that all these additional workers can live and  work near their place of employment.

Policy implications high-lighted in the Report are that:
  1. Local jurisdictions are not presently planning for sufficient housing to accommodate a significant increase in future workers.
  2. More housing is needed closer to workers’ jobs.
  3. More multi-family, affordable owner and renter houses are needed.
  4. A lack of such housing (whether close to public transit or not) will mean more out-of-region commuting. This will aggravate the Washington area traffic congestion, already the worst in the country.
  5. It will also mean more income spent and taxes paid outside work jurisdictions, such as Reston.
Accepting the 731,000 unit figure, the fundamental housing problem is that 25% of units will need to be priced at under $200K, 44% between $200K and 399K, 26% between 400K and 599K with only 6% above the last figure. All these suppositions are backed by impressive wage-level, jurisdictional and employment segment estimates, incidentally. Nevertheless, as the Report says blandly, “In some markets, it would be very difficult to build new units at these lower prices, without significant subsidy.”

Other significant findings are:
  1. Today, no jurisdiction in the Washington area has a housing policy designed to respond adequately to its economic growth potential and workforce requirements.
  2. If jurisdictions such as Reston are dependent on non-residential workers, they will have to spend significantly on extra transportation services. On the other hand, if they can accommodate predominantly resident workers, they will incur much lower expenditures.
  3. As noted above, if workers are resident, they will spend money and pay taxes locally.
The Report’s headline apart, its findings do not sound very promising for Reston at this time. All the more so, given that Fairfax County, together with Loudoun and Montgomery Counties and DC, are the jurisdictions where the greatest growth is predicated.

While it is beyond the remit of the Report, it would have been useful had the authors been able to estimate how much new office space may be required, given high present vacancy levels across the region. Also, the Report could have looked at possible effects of telecommuting on their conclusions. In support of their findings, besides Bank of America, the authors listed a number of experts, plus NVR, Kettler, and Gordon, Smith Inc. IHS Global Insights was a prime source of statistics and information. 

All in all, this is a thought-provoking, timely and interesting Report. It will need careful review and questioning, of course, given the big potential for error and the lack of Reston-specific developer, real estate and Fairfax County input.

John Hanley, Co-Chair Reston 2020
Reston Citizens Association Board Member

Monday, February 21, 2011

Reston's 2010 Official Census Population is 58,404 in 25,522 Households

The first table provided by Census 2010 on Reston CDP breaks down its total population by race and ethnicity.  It shows that Reston's population is 58,404 in 25,522 households.  Here's the table:
 
 
QT-PL - Reston CDP, Virginia: Race, Hispanic or Latino, Age, and Housing Occupancy:  2010
2010 Census Redistricting Data (Public Law 94-171) Summary File
Subject Total 18 years and over
Number Percent Number Percent
POPULATION
  Total population 58,404 100.0 46,226 100.0
RACE
  One race 56,034 95.9 44,880 97.1
    White 40,959 70.1 33,782 73.1
    Black or African American 5,654 9.7 4,061 8.8
    American Indian and Alaska Native 183 0.3 128 0.3
    Asian 6,382 10.9 4,931 10.7
    Native Hawaiian and Other Pacific Islander 26 0.0 23 0.0
    Some Other Race 2,830 4.8 1,955 4.2
  Two or More Races 2,370 4.1 1,346 2.9
HISPANIC OR LATINO AND RACE
  Hispanic or Latino (of any race) 7,479 12.8 5,184 11.2
  Not Hispanic or Latino 50,925 87.2 41,042 88.8
    One race 49,073 84.0 40,013 86.6
      White 36,952 63.3 30,963 67.0
      Black or African American 5,467 9.4 3,932 8.5
      American Indian and Alaska Native 99 0.2 69 0.1
      Asian 6,328 10.8 4,903 10.6
      Native Hawaiian and Other Pacific Islander 22 0.0 21 0.0
      Some Other Race 205 0.4 125 0.3
    Two or More Races 1,852 3.2 1,029 2.2
HOUSING UNITS
  Total housing units 26,787 100.0
OCCUPANCY STATUS
  Occupied housing units 25,522 95.3
  Vacant housing units 1,265 4.7
(X) Not applicable
Source: U.S. Census Bureau, 2010 Census.
2010 Census Redistricting Data (Public Law 94-171) Summary File, Tables P1, P2, P3, P4, H1.